A semantic layer is something we use every day. We build dashboards with yearly and monthly aggregations. We design dimensions for drilling down reports by region, product, or whatever metrics we are interested in. What has changed is that we no longer use a singular business intelligence tool; different teams use different visualizations (BI, notebooks, and embedded analytics).
Instead of re-creating siloed metrics in each app, we want to define them once, open in a version-controlled way and sync them into each visualization tool. That’s what the semantic layer does, primarily defined as YAML. Additionally, the semantic layer adds powerful layers such as APIs, caching, access control, data modeling, and metrics layer.
What is a Semantic Layer?
A semantic layer is a translation layer that sits between your data and your business users. The semantic layer converts complex data into understandable business concepts. For example, your database may store millions of sales receipts which contain information such as sale amount, sale location, time of sale, etc. However, your business users may not have the technical capabilities to convert such raw data into actionable insights such as revenue per store, which brand is most popular, etc. By translating business terms into a format that is understood by the underlying database, the Semantic Layer allows business users to access data using terms that they are familiar with.
You can think of a semantic layer as a translation layer between any data presentation layer (BI, notebooks, data apps) and the data sources. A translation layer includes many features, such as integrating data sources, modeling the metrics, and integrating with the data consumers by translating metrics into SQL, REST, or GraphQL.
Because everyone has different definitions of “active" users or “paying" customers, the semantic layer allows you to define these discrepancies once company-wide. Describing each of them earlier in the semantic layer, instead of three different versions in each BI tool, avoids having contrasting numbers in various tools. And what if the metric changes to a new definition? With a semantic layer, you change only once. This powerful feature empowers domain experts and data practitioners to get a common understanding of business metrics.
Metric, KPI, and (calculated) measure are terms that serve as the building blocks for how business performance is both measured and defined, as knowledge of how to define an organization’s KPIs. It is fundamental to have a common understanding of them. Metrics usually surface as business reports and dashboards with direct access to the entire organization.
For example, think of operational metrics that represent your company’s performance and service level or financial metrics that describe its financial health. Today these metrics are primarily defined in a lengthy SQL statement inside the BI tools.
Calculated measures are part of metrics and apply to specific dimensions traditionally mapped inside a Bus Matrix. Dimensions are the categorical buckets that can be used to segment, filter, group, slice, and dice—such as sales amount, region, city, product, color, and distribution channel. Dimensions (and facts) are also known from the concept of Dimensional Modeling.
Let’s see an example of how we define metrics such as “amount of users" and “paying users" and related dimensions city and company (more on Cube Data Schema). At its core, the semantic layer takes a metric request as input:
|
|
and returns a translated SQL query of its destination interpreter (mostly SQL, REST, GraphQL) and extracts those metrics as an output:
|
|
In new semantic layers, key business metrics are defined non repetitively by the business and data teams as code (YAML). The goal is to abstract metrics so business people can discuss with data engineers and transfer ownership closer to the domain experts. The metrics are higher-level abstractions that are stored in a central repository in a declarative manner.
The most famous existing semantic layer is LookML from Looker. The difference is that we separate that part of all BI tools and centralize them. Doing so allows us to define them once in a structured and source-controlled way instead of inside a proprietary tool.
Understanding Transformation Layer vs Semantic Layer
The transformation logic (e.g., dbt) and logic hosted in metrics are different. A semantic layer transforms/joins data at query time, whereas the transformation layer does during the transform (T) step of ETL/ELT, meaning it’s pre-calculated.
In the transformation layer, you must balance low and high granularity. What level do you aggregate and store (e.g., rollups hourly data to daily to save storage), or what valuable dimensions to add. With each dimension and its column added, rows will explode exponentially, and we can’t persist each of these representations to the filesystem.
A semantic layer is much more flexible and makes the most sense on top of transformed data in a data warehouse. Avoid extensive reshuffles or reprocesses of large amounts of data. Think of OLAP cubes where you can dice-and-slice ad-hoc on significant amounts of data without storing them ahead of time.
Suppose we would push all metric logic into the transformation layer, with dbt, for example. In that case, we’d lose this agility and store multiple versions of each table with different granularities. Reprocessing when quickly changing a metric would result in long ETL jobs not finishing overnight.
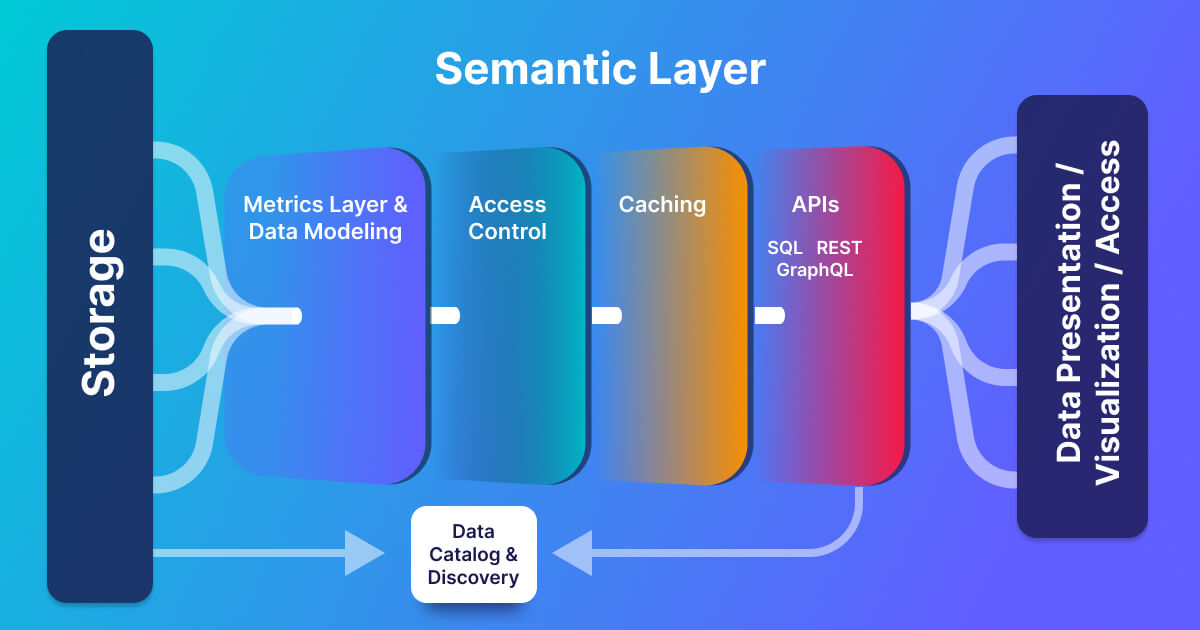
Deep Dive into a Semantic Layers Architecture
As you can see on the illustration below, the semantic layer sits on top of your data storage, mostly after your transformations are done. In smaller data use cases, you could use it on top of your data storage without transforming and do everything logically in the semantic layer. It’s also where data engineers and business/analytics people need to find a standard metric definition before moving metrics downstream to the presentation layer.

An essential question is where the queries are executed. A semantic layer does not include a compute per se – you can substitute that with Kubernetes, other compute engines, or respective cloud offerings of semantic layers. Still, your semantic layers use computing where data lives – push-down. Push-downs are more difficult if you join multiple sources, but it’s not a problem if you only pull from your warehouse.
Recapping: Managing today’s data ecosystem – and gaining valuable business insights – is a challenge for all companies, and that’s where the semantic layer helps:
- It builds bridges between business and (data) engineers. A time-saving solution for accessing a specific data set on top of your data stack.
- It centralizes business logic definitions that everyone agrees with, having the DRY principle applied across BI tools and the data stack. Key metrics can be easily tracked.
- The semantic layer improves data warehouse performance by taking on processing burden to meet the analyst’s needs. Moreover, it significantly reduces analytics processing costs.
- It offers an easy entry, as it can be the start of a future enterprise data warehouse project.
What a Semantic Layer Is Not
Before we cover more on the history and trends of a semantic layer, let’s quickly cover what it is not. It is
- not a replacement for the transformation layer or BI tools
- not an all-in-one solution that replaces everything
- not an OLAP cube
The History of a Semantic Layer
The semantic layer is not something entirely new. The concept existed since 1991 when SAP Business Objects (BO) patented it. As an early Business Intelligence engineer, I used lots of BI tools. I was always impressed by the BO universe and how you could abstract complex queries and models away from the business users, and design it to their understanding of the world.

The basic or key component of business intelligence was always a semantic layer. It allowed an abstraction or translation from technical terms to business terms, such as facts and dimensions, and mapped it to more understandable models for the business. But it was always part of the BI Tools or the query or reporting layer.
Later, when we had OLAP Cubes, such as the famous SSAS one, they also had their own semantic layer called data source view or cube structure, where you defined relations, measures, dimensions, and calculated measures. Also, remember the famous Bus Matrix, where you define measures to their dimensions.

The SAP BO Universe was a semantic layer that closed the gap between technology and business with an intermediate layer. You could define logical objects on top of physical ones, basically a CTEs at query time. Similar, but not a semantic layer, Master Data Management (MDM) came up later and tried to ensure master data (e.g., customer, product, address) is consistent, accurate, and maintained once with semantic consistency. Giving accountability with stewardship to the business users. MDM’s most popular tool I used was SQL Master Data Services (MDS) by Microsoft, which was announced in 2008 and updated last in 2015.
Around the same time (July 2008), as MDS was announced, another tool called Jinja Template was released for the first time. It is not a semantic layer, but it helps define complex business logic within Python or SQL code. The Jinja template didn’t get much popularity inside the data world until dbt was announced and used heavily to mitigate the downside of SQL, creating complex models. dbt was originally started at RJMetrics in 2016 but took off later in 2018 when Fishtown Analytics (now called dbt Labs) more publicly showed it, and the market was more ready for it.
People built huge semantic business layers on top of dbt and Jinja templates but lacked many features, such as ad-hoc definition and a declarative approach–dbt is imperative. You need to run a dbt run to get anything.
Besides other BI tools having similar modeling language to define metrics, Looker, with its LookML language, popularized the modern semantic layer methodology. It wasn’t called such, but people saw its benefit and used Looker heavily. Later, when data grew exponentially, and companies didn’t use a single BI tool any longer, the need for transferring these metrics and calculated business logic to other tools such as Notebooks and excel sheets grew.
In 2021, the “new" modern semantic layer rose in popularity with tools MetriQL, Minerva by Airbnb, MetricFlow, Supergrain, or Cube.js.
- 1991: SAP BusinessObjects Universe and BI semantic layer
- 2008: Master Data Management (MDM) (with MDS from Microsoft in 2008)
- 2013: Kimball discussed the concept of a semantic layer in #158 Making Sense of the Semantic Layer
- 2016: Maturing BI tools with an integrated semantic layer such as Tableau, TARGIT, PowerBI, Apache Superset, etc. have their own metrics layer definition
- 2018: Jinja templates and dbt eroding the transformation layer into a semantic layer
- 2019: Looker and LookML popularized as the first real semantic layer
- 2022: Modern Semantic Layer, Metric Layer or Headless BI tools such as MetriQL, MetricFlow, Minerva, dbt arose with the explosion of data tools (BI tools, notebooks, spreadsheets, machine learning models, data apps, reverse ETL, …)
The Rise of the Semantic Layer
Let’s talk about why the data world is picking up the semantic layer again and where it fits into the Data & AI Landscape and the Modern Data Stack.

Several high-level reasons explain the rise of the semantic layer:
- The need for abstractions for complex business constructs and creating bridges between business people and engineers at a centralized place with code.
- Reduction of metric duplications eases the understanding and agreement on metrics.
- The demand for data lineage also contributes to the metrics and semantic layer. It’s the first place where data consumers want to know where the data comes from.
- The semantic layer is a core component between existing tools and rising concepts such as OLAP cubes, data virtualizations, data catalogs or data mesh, and data contracts.
Diving into more details of each bullet point above.
With the fast-rising complexity of data and its ecosystem, you also need better abstractions! They are lowering the bar for people to enter the field by easing up the process and complex data world. We’ve seen this with React for websites, Terraform for Kubernetes, and Dagster for orchestration. But yet, we miss one for metrics. That’s where the interest in the semantic layer comes from. With it, we abstract complex business requirements into smaller and easier-to-handle blocks.
With open-source on the rise, it was natural that the next semantic layer would be open-source. Unlike Business Objects in the old days, see Transform that started closed-source but ended up open-sourcing part of it with MetricFlow. With metrics and the semantic layer rising as a core component, we want to have this layer open-sourced, avoiding the old trap of siloed data.
With abstractions and open-source, we also ride the wave of the declarative approach. What does that mean? It means predefined data types and syntax for data modeling, such as how to create a distinct count measure or define a dimension. It also means that you can describe your metrics in a declarative way, e.g., YAML, without running anything ahead of time. The framework is more supportive with pre-defined abstractions, e.g., the most complex profit calculation is just one variable you can reference.
By abstracting and making it declarative, it will be less error-prone, with less complexity and code duplication. If we look at the modern data stack and how the data flows, we see many ways to improve or intercept metrics along the way:
- Managed ETL and ELT that integrates data from various data sources
- Data storage such as data warehouse or data lake
- Data transformation layer that processes ingested data using SQL, Python, or YAML
- Different BI dashboards, notebooks, machine learning models, or data apps for visualization
- Data governance and data quality processes
There is a lot of business logic involved in each step. For example, you clean up NULLs or fix improper formatting of dates in step one. You might add serverless functions on top of data warehouses or lakes to transform data but certainly, add a lot of data modeling and transformation in your transformation layer. And even more metrics and complex business calculations in the relevant BI tools. Plus, some cleaning up is happening in the data quality and governance.
This example illustrates that it’s hard to sync these different logics and even different languages into one solution. That’s what the semantic layer try to solve holistically, making it so powerful.
There are also big problems with such an approach, which we will explore in a later chapter. But another benefit you get from it is data lineage. As you have a semantic layer that explains many of your business logic declarative ways, you can also express where the source is and how it’s been transformed in your data. The more you have end-to-end, you can also do column-level lineage. This lineage is a huge step toward a more self-serve approach we all try to create. It’s also a way to move closer to the source data and the transformation layer.
Trends: What Tools Are Out There for Building a Semantic Layer?
As we’ve now learned a lot about the semantic layer, let’s see actual tools, focusing on open-source.
The most commonly named tools are Cube.js (recently renamed Cube), MetricFlow, MetriQL, dbt Metrics, or Malloy. Where MetriQL was the first open-source but Transform.co working on a closed-source version that eventually got open-sourced into MetricFlow. Also, dbt announced their metrics system back at Coalesce the Metric System, and turning it now into dbt Semantic Layer (more to come in October at dbt Coalesce Conference). According to GitHub stars, Cube is the fastest growing tool in this area, and already has many integrations including data sources and data visualizations – for example, it integrates with dbt Metrics.
MetricFlow and Cube’s semantic layer overview is fascinating to compare, where Cube talks about headless BI and MetricFlow about the metrics layer. As discussed above, you understand why both try to address not only the metrics part but also data modeling and abstract away all data sources by adding access control, caching, and APIs.

When do you need such a tool? There are two initial use cases: First, if you won’t build a significant data architecture, you could start with your sources and access your data sources or cloud warehouse. The second one is when your company size and data-savvy people are growing. More people need transformations, defining metrics, or adding many data and SaaS tools; you need alignment around definitions.
Some trends: Supergrain initially also had a metrics layer but pivoted to personalized marketing. If we look solely at the GitHub stars, it is a bit unfair for MetricFlow as they worked to log on that problem but only open-sourced it, but still, it gives a good impression about cube.js. They also just announced the Unbundling of Looker in combination with Superset. Furthermore, there is a dedicated Semantic Layer Summit.

A deeper comparison of the tools you find on How is this different from. There is an extensive list of closed-source solutions such as uMetric by Uber, Minerva by Airbnb, Veezoo, and more.
Problems of a Semantic Layer
Besides all the positive things mentioned, some challenges come with a semantic layer. First of all, it is another layer that needs integration with many other tools. Another significant downside is having to learn another solution that needs to be operationalized as a critical component of your data stack. The cost of maintaining and creating such a layer is high.
There is also a hidden complexity in generating these queries on the fly. Every query needs to be generated for different SQL dialects–e.g., Postgres SQL and Oracle SQL are not 1:1 the same. That can be both problematic in terms of latency but also in terms of producing a faulty SQL query. The counter-argument is that it’s still easier to maintain copies of data sets and re-do the metrics repetitively inside a BI dashboard.
When you use extensive exposed APIs, you might run into performance issues, as pulling lots of data over REST or GraphQL is less than ideal. You can always switch to SQL directly, but mostly with losing some comfort.
As always, it depends on the criticality of centrally defined metrics that everyone agrees on, or you can live in minor drift away in different tools.
What’s the Difference to OLAP, Data Cataloging, Virtualizations, or Mesh
As the semantic layer is something central and intertwined with lots of related data engineering concepts, we discuss here how they relate to each other.
OLAP Cubes
As part of the semantic layer, the cache layer can be seen as a replacement for modern OLAP cubes such as Apache Druid, Apache Pinot, and ClickHouse. Similar attributes with defining the queries ad-hoc and delivering sub-second query times. OLAP cubes are the fastest way to query your data if you do not have updates in your data.
Compared to an OLAP solution, the benefit of the semantic layer is avoiding reingesting your data into another tool and format; it happens under the hood, for good or worse. A caching layer is another complex piece, as it’s always outdated as you add more data; it needs to constantly update its cache as you do not want to query old invalidated data.
That’s also where it gets interesting how semantic layer tools solve it. For example, Cube tried to implement with Redis but reverted and built their own caching layer from scratch. On the upside, OLAP cubes have built-in computing where you can run heavy queries.
Data Virtualization and Federation
Data Virtualization comes up in many discussions related to the semantic layer. Still, even more to the semantic layer is data virtualization, with tools such as Dremio that try to have all data in-memory with technologies such as Apache Arrow. Data federation, very similar to virtualization, mostly referred to technologies like Presto or Trino.
These are versions of a semantic layer, including a cache layer with access management, data governance, and many more. It has a powerful option to join data in its semantic layer. In a way, they are the perfect semantic layer, although Dremio, and also Presto have branded themself as an open data lakehouse platform lately. Which brings us to another question.
Is a lakehouse nothing else than a semantic layer?
In a way, they have similar attributes, but a lakehouse includes an open storage layer (Delta Lake, Iceberg, Hudi). In contrast, the semantic layer is more ad-hoc, query-time driven. Still, the lakehouse from Databricks tries to store only once and avoid data movement as much as possible by querying it with their compute engine Photon.
The problem is, the platform itself is not open-source, only storage, and the metrics are not defined in a declarative way. They are mostly entangled in notebooks or UI-based tools.
Data Mesh and Data Contracts
Two recent popular terms are Data Mesh and Data Contract. Both are pulling in the same direction of giving more power to the domain experts who know the data best, away from engineers who should be more focused on a stable system.
In my opinion, giving more control also needs an easier way for these domain experts to define their metrics in a standardized way, being declarative directly on the Data Assets, but with a standardized tool—which is the semantic layer for me. But in contrast to data mesh, which is decentralized, the semantic layer fancies a very centralized approach for metrics.
Data Catalogs
A data catalog is another way of centralizing metrics and Data Products. It’s similar to a semantic layer but focuses more on the physical data assets than the metrics query. Plus, it has another focus: providing a Google search to your data assets such as dashboards, warehouse tables, or models. Modern tools such as Amundsen or DataHub allow you to rate and comment on the data assets, adding metadata such as an owner so that people easily find the best data collaboratively set for their job.
The Semantic Warehouse
A Semantic Warehouse is a term I heard from Chad Sanderson for the first time a month ago. He does a great job putting the words semantic layer, semantic mapping, metrics layer, and data catalog on a data map, as seen in the image below.

What’s interesting here is that the semantic layer is directly on top of the apps, services, and DB between semantic mappings and the metrics layer. It acts as a Data Contract between the real world and the data team. In my opinion, this is what a semantic layer is described in great detail above.
Analytics API
In the above semantic warehouse illustration, the semantic mapping seems to be the data orchestrator, and the metrics layer is the subset of the semantic layer that holds the metrics themselves. This is interesting because I implemented such a thing (parts of it), and I wrote about it in a similar way in Building an Analytics API with GraphQL. I called it Analytics API with its core components of an API and query engine, data catalog, data orchestrator, a SQL connector, and of course, the metrics layer. It has the same function and the same component but is visualized as a single analytics API component. Queries through the access layer connecting heterogeneous data stores.
Will the Semantic Layer Get More Adoption?
The semantic layer is an abstract construct that is hard to grasp. It has many touching points with existing concepts and similarities with other upcoming ones.
If it were a new construct, I’d say it’s just another buzzword. But as it started in 1991, as seen in the history of the semantic layer, and evolved into the modern data stack and adapted to today’s needs.
It’s still hard to implement all features we’ve discussed here; that’s the theoretical view. But I believe if you start with getting a more diverse architecture with lots of spread-out tools, the semantic layer has its stands for staying. Start with your basic requirements. Maybe you need a central access layer for people to access data quickly. Or you do not want to add another complex layer with an OLAP cube on top and search for an efficient cache layer. Or most importantly, if you’re going to define your metric in a central place with a thin layer, start with the concept of the semantic layer and its definition of metrics.
Learn along the way. Check out the above tools mentioned and see if they work out. These days, the tech makes it very easy to start a POC, e.g., define some of your BI metrics inside a semantic layer and sync it into your BI tool. Try to get a feeling for it.
Besides the must needs such as data integration, transformation at ingest, visualizing, and orchestrating, I see the semantic layer as the next step for defining metrics in a standardized way.
—
If you want to read more, I pulled together an extensive list of other articles on that topic in our data glossary on What is a Semantic Layer.
Originally published at Airbyte.com